
Grade 5 GT Mathematics
Statistics & Probability (6.SP)
Building on and reinforcing their understanding of number, students begin to develop their ability to think statistically. Students recognize that a data distribution may not have a definite center and that different ways to measure center yield different values. The median measures center in the sense that it is roughly the middle value. The mean measures center in the sense that it is the value that each data point would take on if the total of the data values were redistributed equally, and also in the sense that it is a balance point. Students recognize that a measure of variability (interquartile range or mean absolute deviation) can also be useful for summarizing data because two very different sets of data can have the same mean and median yet be distinguished by their variability. Students learn to describe and summarize numerical data sets, identifying clusters, peaks, gaps, and symmetry, considering the context in which the data were collected.
In Grade 6, students build on the knowledge and experiences in data analysis developed in earlier grades. They develop a deeper understanding of variability and more precise descriptions of data distributions, using numerical measures of center and spread, and terms such as cluster, peak, gap, symmetry, skew, and outlier. They begin to use histograms and box plots to represent and analyze data distributions. As in earlier grades, students view statistical reasoning as a four-step investigative process:
Such investigations involve making sense of practical problems by turning them into statistical investigations; moving from context to abstraction and back to context; repeating the process of statistical reasoning in a variety of contexts.
In Grade 6, students build on the knowledge and experiences in data analysis developed in earlier grades. They develop a deeper understanding of variability and more precise descriptions of data distributions, using numerical measures of center and spread, and terms such as cluster, peak, gap, symmetry, skew, and outlier. They begin to use histograms and box plots to represent and analyze data distributions. As in earlier grades, students view statistical reasoning as a four-step investigative process:
- Formulate questions that can be answered with data
- Design and use a plan to collect relevant data
- Analyze the data with appropriate methods
- Interpret results and draw valid conclusions from the data that relate to the questions posed.
Such investigations involve making sense of practical problems by turning them into statistical investigations; moving from context to abstraction and back to context; repeating the process of statistical reasoning in a variety of contexts.
NOTE - The "Background Info. and Guided Practice" links require a free registration to use the LearnZillion content. Parents can create a free "Teacher" account here. Once logged in you can access the "Background Info. & Guided Practice" videos without interruption.
What will my child learn?
Students will:
Develop understanding of statistical variability.
6.SP.A.1
Recognize a statistical question as one that anticipates variability in the data related to the question and accounts for it in the answers. For example, "How old am I?" is not a statistical question, but "How old are the students in my school?" is a statistical question because one anticipates variability in students' ages.
6.SP.A.2
Understand that a set of data collected to answer a statistical question has a distribution which can be described by its center, spread, and overall shape.
6.SP.A.3
Recognize that a measure of center for a numerical data set summarizes all of its values with a single number, while a measure of variation describes how its values vary with a single number.
Summarize and describe distributions.
6.SP.B.4
Display numerical data in plots on a number line, including dot plots, histograms, and box plots.
6.SP.B.5
Summarize numerical data sets in relation to their context, such as by:
6.SP.B.5.A
Reporting the number of observations.
6.SP.B.5.B
Describing the nature of the attribute under investigation, including how it was measured and its units of measurement.
6.SP.B.5.C
Giving quantitative measures of center (median and/or mean) and variability (interquartile range and/or mean absolute deviation), as well as describing any overall pattern and any striking deviations from the overall pattern with reference to the context in which the data were gathered.
6.SP.B.5.D
Relating the choice of measures of center and variability to the shape of the data distribution and the context in which the data were gathered.
Students will:
Develop understanding of statistical variability.
6.SP.A.1
Recognize a statistical question as one that anticipates variability in the data related to the question and accounts for it in the answers. For example, "How old am I?" is not a statistical question, but "How old are the students in my school?" is a statistical question because one anticipates variability in students' ages.
- Check for Understanding: Statistical Questions
- Enrichment Tasks: Button Statistical Questions | Identifying Statistical Questions
6.SP.A.2
Understand that a set of data collected to answer a statistical question has a distribution which can be described by its center, spread, and overall shape.
- Check for Understanding: Analyzing Data with Box Plots | Describing Distributions with Center and Spread
- Enrichment Tasks: Puppy Weights
6.SP.A.3
Recognize that a measure of center for a numerical data set summarizes all of its values with a single number, while a measure of variation describes how its values vary with a single number.
- Background Info. & Guided Practice
- Check for Understanding: Mean, Median and Mode | Understanding the Mean
Summarize and describe distributions.
6.SP.B.4
Display numerical data in plots on a number line, including dot plots, histograms, and box plots.
- Check for Understanding: Analyzing Data with Dot Plots | Creating Dot Plots | Creating Bar Charts | Creating Box (and Whisker) Plots
- Enrichment Tasks: Puzzle Time
6.SP.B.5
Summarize numerical data sets in relation to their context, such as by:
- Check for Understanding: Analyzing Data with Box Plots | Reading Bar Charts 1 | Reading Bar Charts 2 | Reading Bar Charts 3 | Reading Pictographs 1 | Reading Pictographs 2
6.SP.B.5.A
Reporting the number of observations.
- Background Info. & Guided Practice
- Check for Understanding: Reading Bar Charts 1 | Reading Pictographs 1 | Reading Pictographs 2
6.SP.B.5.B
Describing the nature of the attribute under investigation, including how it was measured and its units of measurement.
6.SP.B.5.C
Giving quantitative measures of center (median and/or mean) and variability (interquartile range and/or mean absolute deviation), as well as describing any overall pattern and any striking deviations from the overall pattern with reference to the context in which the data were gathered.
- Background Info. & Guided Practice
- Check for Understanding: Mean, Median and Mode
6.SP.B.5.D
Relating the choice of measures of center and variability to the shape of the data distribution and the context in which the data were gathered.
- Check for Understanding: Exploring Mean and Median
- Enrichment Tasks: Electoral College
|
What are some signs of student mastery?
|
Tools & Technology
NCTM's Advanced Data Grapher can be used to build and analyze data using box plots, scatterplots, histograms, stem-and-leaf plots, and bubble graphs. You can enter multiple rows and columns of data, select which set(s) to display in a graph, and choose the type of representation. 'What's a dot plot?' See if this resource and accompanying video help deepen your understanding. |
More 4 U
This video introduces the process of building a box plot. 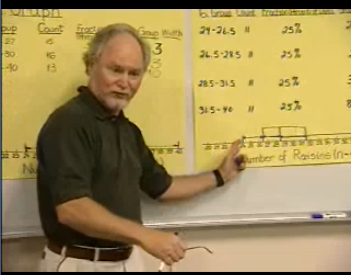
Source: Annenberg Learner
This video illustrates the usefulness of the box plot as a summary of data.
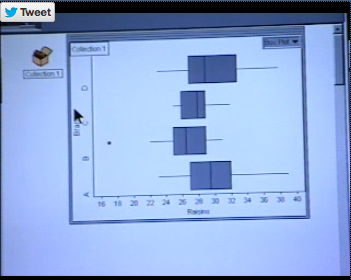
Source: Annenberg Learner
|
